

ARTICLE
5 Reports Every Bloomerang User Should Run To Get To Know Their Donors Better
Who Are These People Anyway?


You have a donor database! Congratulations, all your data is now tucked neatly into organized rows and easy-to-access fields. Well done!
Now, who exactly are all of these people in your database?
There’s a rule of thumb home organizers use that says you should always keep your belongings in a place where you can see them, or you risk forgetting that you have them. So your pantry shelves should be stocked in a way where you can see every can of beans and every box of Rice-A-Roni, to keep you from accidentally buying more of them. I like to think that the same rule applies to our databases – let’s pull our supporters into organized lists so we can see them and appreciate them!
Your database is probably home to people from a ton of different sources – your online donors, your direct mail donors, your volunteers, people who signed up on your website, people who registered for one of your events, people who fall into more than one of those categories, etc. It’s a bit like a packed kitchen cupboard with items stacked three deep. What’s in there, anyway?
So to get started, log into your database and note the total number of people. In Bloomerang, you can do this by going to your Constituents tab and writing down the number that you see in the blue box on this page. This is the number that we’ll be working with from here on.
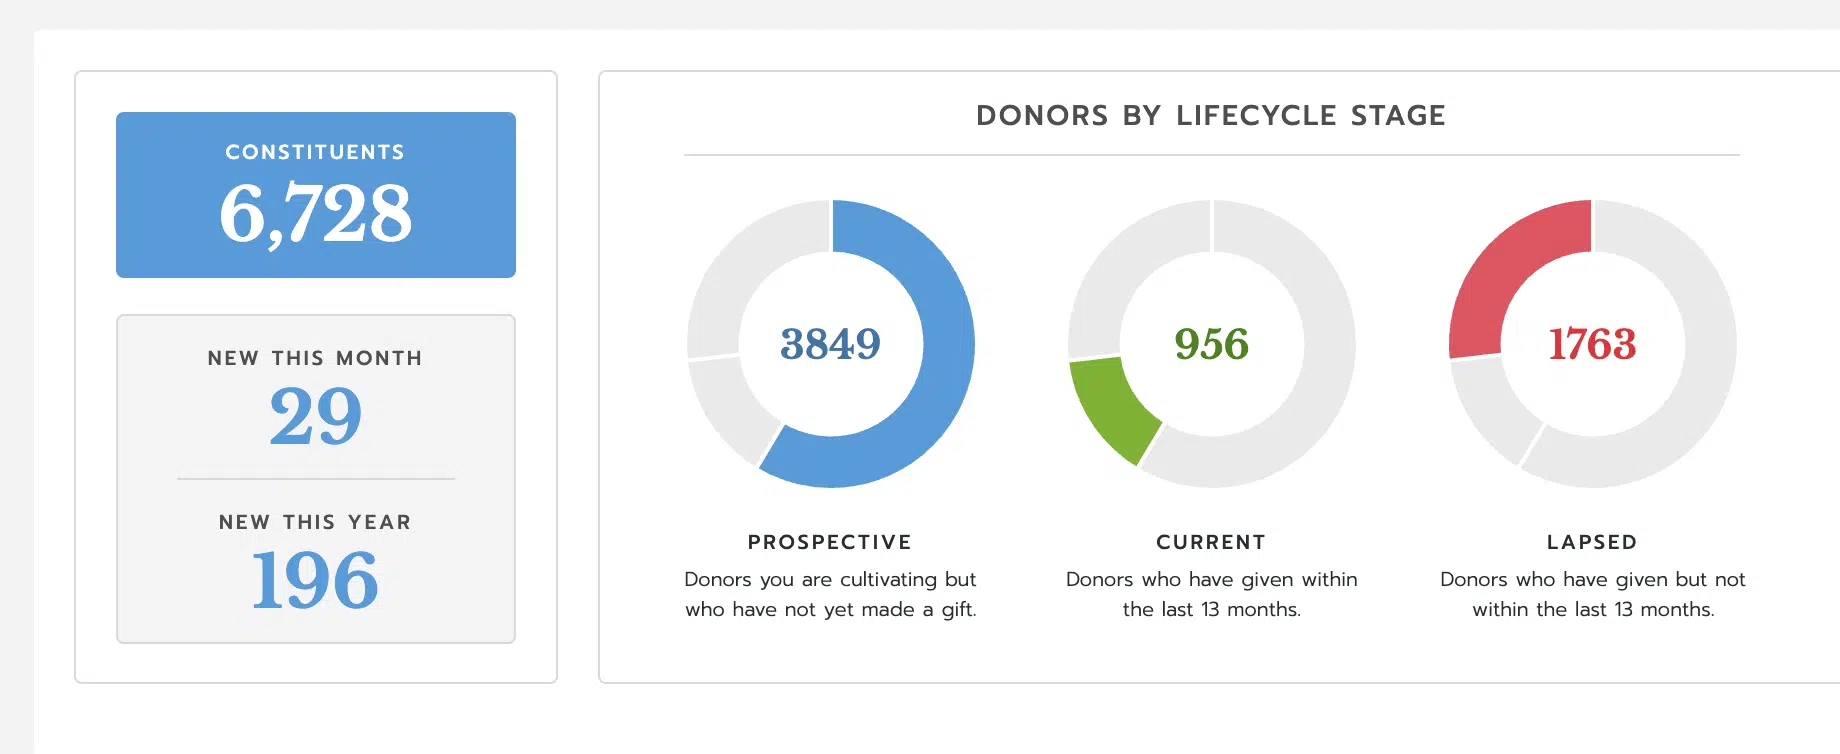
So for example, you may see a number like 6,728, as pictured.
If anyone needs a quick tutorial on the basics of running Bloomerang reports, this is a great place to start!
Let’s get started. Out of all of the constituents in your database, how many of them have given a gift?
Note that we’re interested in how many people have given a gift, not how many gifts have been given, so we’re going to choose the Constituent report type (instead of the Transaction type).
How to find this in Bloomerang:
Reports → New → Build a report from scratch → Constituent
Filters:
Include → Add filter → Has any Transactions → OK
Columns:
Add a new column → Latest transaction date + Latest transaction amount
Now we have a list of people who have given a gift of any kind. That’s great! In the case of this particular database, the total number of results is 2,827 people. That means that 42% of the people in this database are donors (2,827 people out of 6,728).
–> Pro Tip:
You can also sort the results by the “Latest transaction date.” Take a look at how many of these donors gave recently compared to a few years ago, to give a sense of how engaged your donor base is.
We now know the total number of people who’ve ever given to your organization, but let’s get a little more specific: how many of these donors have given recently, for the first time?
Luckily, this is super easy using Bloomerang’s saved report templates. Select the “Newest donors” report type, which will show you everyone who’s given in the last 90 days.
How to find this in Bloomerang:
Reports → New → Start from a template → Newest donors
–> Pro Tip:
Use Bloomerang’s built-in report scheduling tool (under the “Save And” menu) to email this report to yourself on the first of each month, as a reminder that these are the folks who could use some extra attention this month.
Okay, we’re getting a clearer picture of who’s in our database. We know who our donors are — including the newest arrivals. What about the folks who’ve been here for a while, loyally contributing to the cause for several years?
Using another one of Bloomerang’s saved report templates, we can pull up everyone who has given multiple times in the last five years. This is a super sophisticated, very handy report – note that we have columns showing us the annual giving total for each donor for this year and the previous five years before this.
How to find this in Bloomerang:
Reports → New → Start from a template → Most loyal donors
This report showcases one of the best features of running Bloomerang reports: you can add any columns you want to a report, and those columns do math for you. Take a look at how the annual total columns are structured:
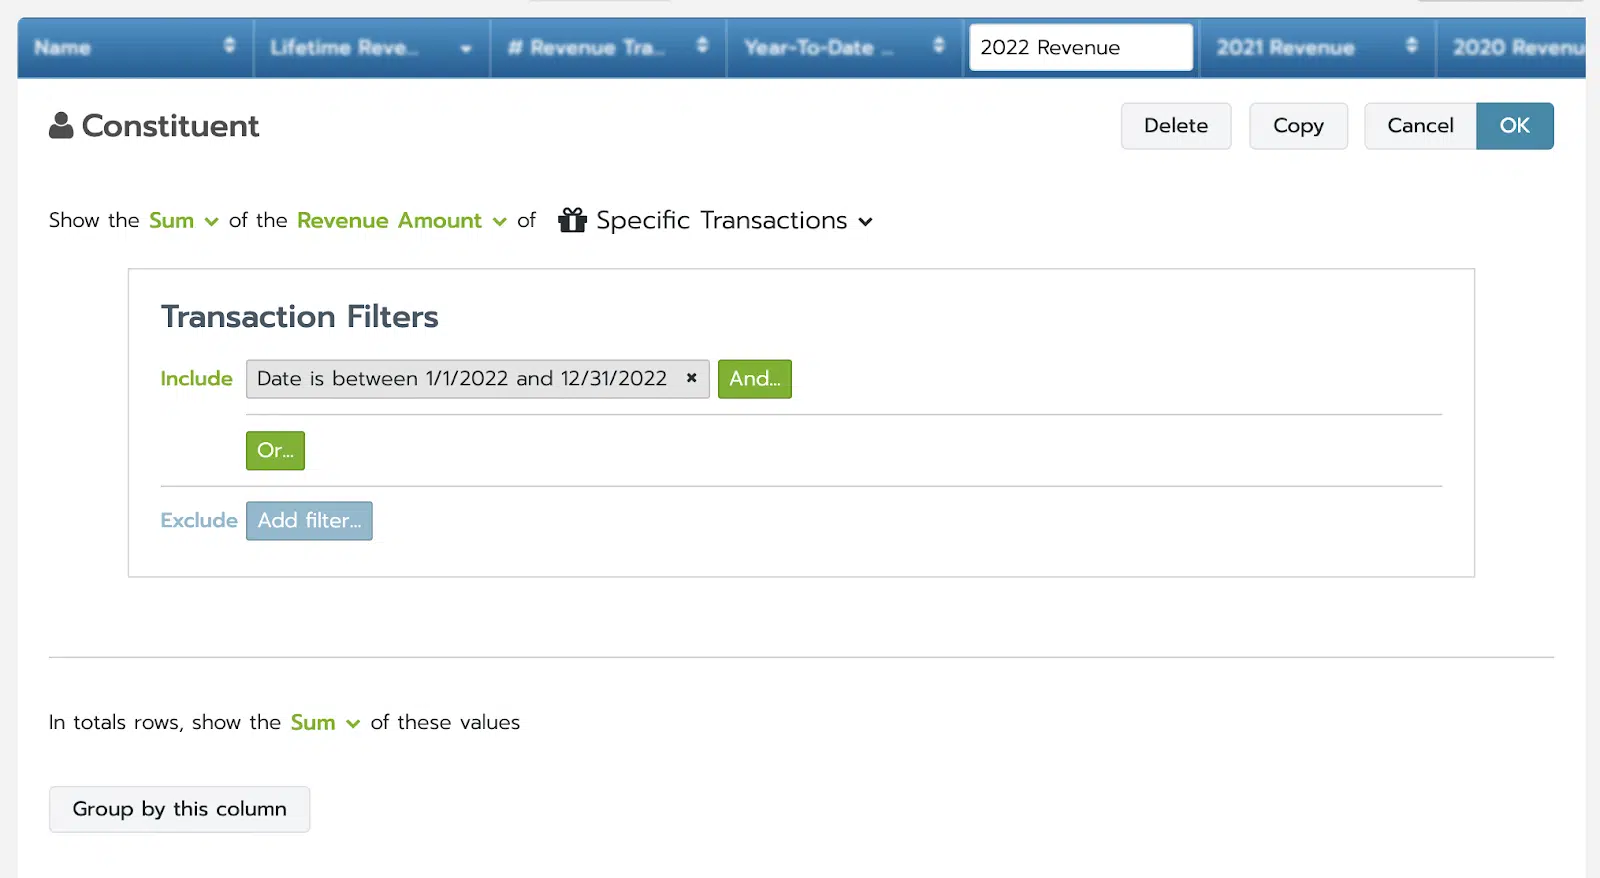
Since this is a Constituent report, we can pull in the calculated Sum (yay math!) of the Revenue Amount of every donation this Constituent gave in a specific year, and display it as a column in this report. We can also name this column whatever we want, so that we remember what it is. And then once we hit “OK” to save it, we can then click on the arrows next to any column name to sort our results by that particular piece of data.
You may already be familiar with this term (the development community loves a good acronym): last year but not this year, or LYBUNT, is used frequently to identify donors who have recently lapsed, but the trail has not yet gone cold. They gave as recently as last year, so we have a pretty good shot at convincing them to give again this year. Let’s take a look at who these folks are.
How to find this in Bloomerang:
Reports → New → Start from a template → LYBUNT
Note this report is going to be structured by fiscal year, not calendar year. You can set your organization’s fiscal year in Bloomerang under Settings → My Organization → Fiscal Year Start.
Last but certainly not least, let’s see who your largest supporters are. I’ve had the pleasure of working with many different nonprofits in my career, and one common refrain I hear over and over again is, “We need more donors. How do we reach more people?” My typical answer to this question is always the same: what about the donors you already have? Let’s prioritize deeper connections over greater volume – and this report will help us do just that.
This report will show us who already knows you, already loves you, and is already making significant gifts to your organization. Knowing who they are will help us give them the gratitude and appreciation they deserve, and build a meaningful relationship with them so they keep giving for years to come.
How to find this in Bloomerang:
Reports → New → Start from a template → Top Donors
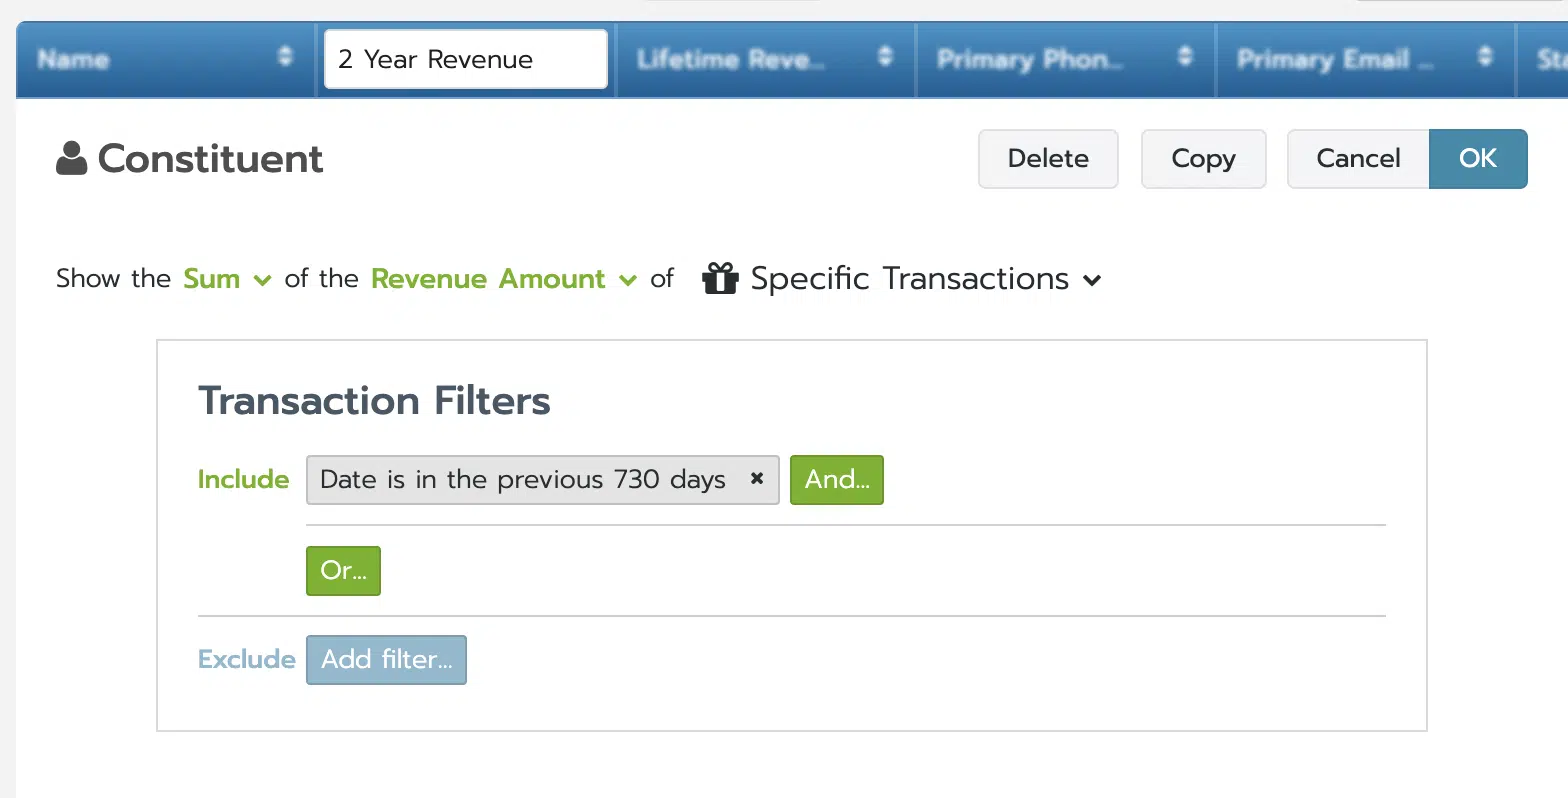
This will pull up a report showing everyone who has ever given a gift to your organization, ranked by the total sum of their gifts from the previous two years (or to be precise, the total they’ve given in the 730 days leading up to this day).
This is another example of a custom column doing math for us:
In summary, these five reports will help you see who has been neatly tucked away into the organized rows of your database. Who should you be focused on engaging with? What goals can we set for ourselves for the future?
If there are additional reports that have helped you learn more about who your supporters are, share them in the comments! We’d love to hear what’s working for your organization.


Comments